🧌 Trollish Tendencies#
One of the earliest rumblings of trouble in Coldridge Valley lies in the caves to the south. Within the caves and the nearby camps dwells the Frostmane tribe. Their encampments cluster near the pond’s edge and cling to the lower slopes of the surrounding mountain ranges, their presence a blight on the landscape. Their theft of tools and supplies disrupts the valley’s quiet routine, and they stand as the first true challenge for any adventurer. All told, the Frostmanes’ activity keeps Coldridge on edge, a reminder that even in these frigid reaches, order is never quite assured.
In my first foray into the Auction House, I noticed that similar kind of disruption. Nestled among the reasonably priced goods are postings that make no economic sense whatsoever: armour pieces carrying exaggerated five-figure gold buyouts; battered grey vendor trash with starting bids set higher than a mount. The deposit fees alone assure the seller a loss. Why list them?
The answer, I suspect, is it’s fun to cause a little harmless trouble. The Auction House is, after all, part of a game. For some players the thrill lies in profit, but for others the thrill is in play, or simply admiring the absurdity of a price tag that no rational goblin would countenance.
My hunch for this exploration is that:
The items widely outside the standard price range are items of negligible value (greys), easily accessible item arbitrage (vendor flip), or visually appealing armour (transmog).
If I am correct, we should see listing patterns concentrate around these categories, with price-points drifting into the implausible. As I won’t be able to determine intent with why someone listed something, I can at least try to see something in the data. To determine the buyout median, we can let \(i \in \{1,\dots,I\}\) be an item ID, \(j \in \{1,\dots,n_i\}\) index the current snapshot’s auctions for that item, and \(B_{ij}\) be the buyout price for listing \(j\). I’ll seek out only listings that are 10 times the median.
To keep the analysis manageable, I’m paring back both the dataset and the filters. Battle-pet listings are very unique which will likely skew the numbers. I’ll also stick to broad, high-level filters at first, as I simply don’t have enough data for finer-grained conditions.
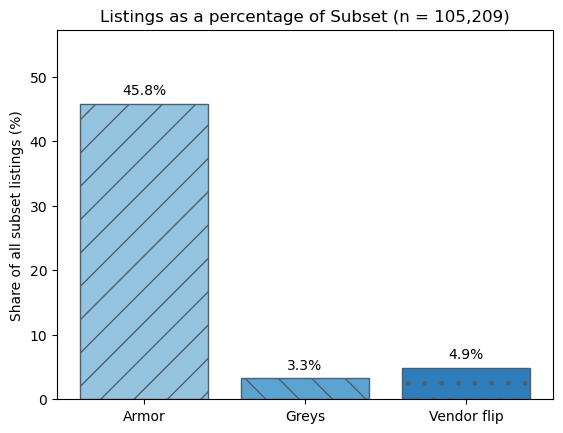
After running the numbers:
| Category | Count | |
|---|---|---|
| 0 | Armor | 48194 |
| 1 | Greys | 3492 |
| 2 | Vendor flip | 5156 |
Greys#
A disproportionate share of the out-of-range listings are armour. Because the dataset lacks a “cosmetic” flag, I’ve used a blunt heuristic of treating every armour piece as a potential transmog item. That catch-all almost certainly inflates the armour count and, in hindsight, weakens my original hunch.
More striking still, even under these generous definitions the three headline categories collectively explain barely half of the inflated-price subset. The vendor-flip filter was tighter (asking price ≥2× vendor cost, restricted to common consumables and recipes), but it still captured far less signal than anticipated.
To uncover what’s hiding in the other half, I’ll need to drill into the data item-by-item, inspecting names and categories directly. I’ll start with the greys:
| Item Name | Item Class | Bid | Buyout | Quality |
|---|---|---|---|---|
| Laminated Scale Bracers | Armor | - | 4.4k🟡 52⚪ | Poor |
| Laminated Scale Shoulderpads | Armor | - | 16.1k🟡 46⚪ | Poor |
| Sharp Shortsword | Weapon | - | 500🟡 | Poor |
| Sharp Shortsword | Weapon | - | 500🟡 | Poor |
| Sharp Shortsword | Weapon | - | 500🟡 | Poor |
| Light Plate Chestpiece | Armor | 34.8k🟡 43⚪ | 36.2k🟡 74⚪ | Poor |
| Twill Vest | Armor | - | 2k🟡 55⚪ | Poor |
| Moth-Ridden Armlets | Armor | - | 228🟡 25⚪ | Poor |
| Dingy Plate Shoulderpads | Armor | - | 12.9k🟡 09⚪ | Poor |
| Dilapidated Cloth Gloves | Armor | - | 2.5k🟡 | Poor |
Many of the “grey” listings that survive the price filter are, in fact, armour pieces. That means I’m counting the same item twice: once as armour and again as grey. Some of these pieces clearly have transmog appeal, just by looking at the number of outfits assigned on WoWHead, and my personal perspective. This makes their inflated prices understandable, but their presence muddies an subset meant to focus on true vendor rubbish.
To keep this slice clean, I’ll exclude any grey items that occupy an armour or weapon slot. For now, I want to concentrate on genuine grey-quality odds-and-ends.
| Item Name | Bid | Buyout | Quality |
|---|---|---|---|
| Autographed Picture of Tigule | - | 206.6k🟡 73⚪ | Poor |
| Haute Club Membership Card | - | 10M🟡 99⚪ | Poor |
| Rock Buddy | - | 15k🟡 | Poor |
| Rock Buddy | - | 14.9k🟡 | Poor |
| Threatening Note | - | 3.3M🟡 06⚪ | Poor |
| Threatening Note | - | 3.3M🟡 06⚪ | Poor |
| Rock Buddy | - | 7k🟡 01⚪ | Poor |
| Charred Recipe | - | 10M🟡 99⚪ | Poor |
| Crumpled Bill of Sale | - | 1.8M🟡 65⚪ | Poor |
| Dazzling Sapphire Pendant | - | 158🟡 72⚪ | Poor |
Novelty Items#
This surfaced exactly the kind of listings I was hoping to find: novelty items. These are things picked up through fishing, random world drops, and solely exist as flavour items. Among them I found pieces like a Threatening Note posted at 3.3 million gold. In the early days of WoW, scraps like these might have led to whispered rumours of lost items and hidden areas.
Topping the frequency chart, to my quiet delight, is the modest Rocky Buddy. Its frequency seemed to support my hunch that these extravagant prices are about play rather than profit, until an outlier shattered that theory.
Listed for just under ten million gold, a Haute Club Membership Card. The card is unusable, it has no stats, no quest, no achievement, no anything. When I started digging deeper, I found forum threads mentioning that its may be a role-play prop. As it’s a tongue-in-cheek status symbol. In other words, the price might not be a joke or a speculative moon-shot; it’s possibly a deliberate signal of prestige for role-playing.
Whether anyone will actually part with ten million gold for the privilege is another question. Still, the card ranks third in overall frequency, just behind Rock Buddy and an achievement item.
Vendor Flips#
In classic World of Warcraft, many profession recipes were sold only by out-of-the-way vendors in distant zones and in limited quantities. Reaching these vendors meant a long ride (or several flight-paths) with no guarantee the item would still be in stock. Savvy players exploited the inconvenience: they camped an alt beside the vendor, bought every restock, ferried the haul to the Auction House, and relisted each recipe at a hefty premium. Most crafters preferred the mark-up to the trek, so flippers earned reliable margins for very little effort.
Given how little the “grey” subset ultimately revealed, my next step is to scrutinise this recipe list item-by-item and confirm whether vendor flips really dominate the category.
| Item Name | Bid | Buyout | Quality |
|---|---|---|---|
| Recipe: Rockscale Cod | - | 30k🟡 91⚪ | Common |
| Recipe: Rainbow Fin Albacore | - | 30k🟡 91⚪ | Common |
| Recipe: Mithril Head Trout | - | 30k🟡 91⚪ | Common |
| Recipe: Smoked Sagefish | - | 30k🟡 91⚪ | Common |
| Recipe: Sagefish Delight | - | 30k🟡 91⚪ | Common |
| Recipe: Brilliant Smallfish | - | 30k🟡 91⚪ | Common |
| Recipe: Elixir of Ogre's Strength | - | 109.6k🟡 11⚪ | Common |
| Pattern: Black Whelp Tunic | 35.1k🟡 88⚪ | 36.5k🟡 08⚪ | Common |
| Recipe: Sneaking Potion | 377k🟡 58⚪ | 392.7k🟡 85⚪ | Common |
| Recipe: Major Dreamless Sleep Potion | 63.3k🟡 60⚪ | 66k🟡 83⚪ | Common |
Many of the recipes topping this category are close-enough to what I expected: Recipes that players wouldn’t want to spend the time to buy. Recipe patterns sold by vendors in the Barrens, Terokkar Forest, and Redridge Mountains. Reachable, but you’ll notice the journey. Notable are the recipes sourced from vendors inside Ironforge itself, only a short stroll from the Auction House. In those cases maybe the seller is banking on impatient buyers who would rather click buyout than cross the Great Forge. Although with the mark-ups being so eye-watering, I suspect this is more mischief.
When I rank the recipe flips by frequency, the pattern lines up more neatly with the far-flung backwater theory: one recipe is from Stranglethorn Vale and two out in Feralas. These are places that are definitely not exactly round the corner for most players. Even so, a sizeable chunk of listings still come from vendors practically next-door to the Auction House. This seems less like convenience gaps and maybe players attempting to be opportunistic?
Item Class Perspective#
With vendor flips and greys out of the way, the next target is the bulky “armour” bucket. My simple filter of including any armour listing as a potential transmog is blunt and not very effective. Because the dataset offers no flag for cosmetic intent, it’ll make it difficult to contextualize the data. Instead of poking at individual auctions, I’ll profile the entire subset to see which item classes actually dominate: is the list truly packed with gear, or do profession reagents, weapons, and other odds-and-ends slip in? A class-level breakdown should tell me what I’m really dealing with and point to a smarter filter.
With vendor flips and greys settled, the next target is the bloated “armour” bucket. Treating every armour listing as potential transmog doesn’t stand up given it represents almost half the dataset. With no clue about cosmetic intent at the item level, the signal is hopelessly noisy. Rather than dive straight into individual auctions and chase ghosts, I’ll profile the entire set of listings priced at ten times the median. Breaking that subset down by item class should help me find my direction.
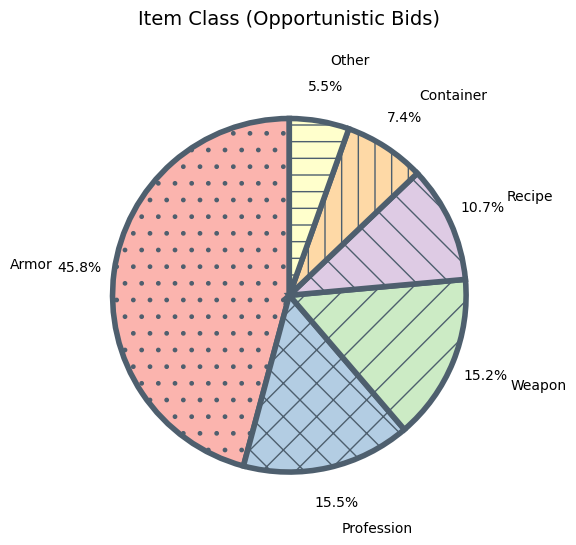
A quick class-level cut of the 10 times median subset reveals that armour and weapons together account for almost 60% of the listings. Profession trail at roughly 15%, while recipes, containers, and a handful of miscellaneous items share the narrow remainder. The recipe slice could be the vendor-flip edge case I expected, and containers could also be the same flavour of convenience resell, but I feel I’ve explored that enough.
What worries me is what the chart omits. I’ve dropped battle-pets from my dataset entirely because their level-scaling quirks are awkward to understand in the data, but I’ve also overlooked gear that has unique properties (player stats). That uniqueness could lift a seemingly ordinary item far above its baseline price and may be inflating the armour bucket. Looking at the individual items in Profession:
| Item Name | Bid | Buyout | Quality |
|---|---|---|---|
| Steelsmith's Apron | - | 27.2k🟡 99⚪ | Uncommon |
| Weavercloth Tailor's Coat | - | 27.2k🟡 99⚪ | Uncommon |
| Weavercloth Tailor's Coat | - | 27.2k🟡 99⚪ | Uncommon |
| Lightweight Scribe's Quill | - | 27.2k🟡 99⚪ | Uncommon |
| Hasty Alchemist's Mixing Rod | - | 27.2k🟡 99⚪ | Uncommon |
| Scrapsmith's Gloves | - | 27.2k🟡 99⚪ | Uncommon |
| Scrapsmith's Gloves | - | 27.2k🟡 99⚪ | Uncommon |
| Steelsmith's Apron | - | 15k🟡 | Uncommon |
| Steelsmith's Apron | - | 15k🟡 | Uncommon |
| Storyteller's Glasses | - | 70k🟡 | Uncommon |
Random Number Generators#
What I suspect is really happening here is RNG at work. Every time one of these items is crafted, the game rolls its stats completely at random. Maybe nine times out of ten the roll is a dud, so those pieces set the median in the market. But every so often the numbers line up just right and you get an ideal item, and that one goes up with a sky-high buyout.
When exploring the frequency of these items, I don’t see anything revealing.
| Item Name | Count |
|---|---|
| Right-Handed Magnifying Glass | 711 |
| Proficient Blacksmith's Hammer | 700 |
| Proficient Blacksmith's Toolbox | 683 |
| Weavercloth Tailor's Coat | 682 |
| Incanter's Shard | 672 |
| Bismuth-Fueled Samophlange | 658 |
| Hideseeker's Pack | 644 |
| Runed Bismuth Rod | 632 |
| Gemcutter's Apron | 628 |
| Radiant Loupes | 627 |
If I dive into the armour bucket, I’m almost certain I’ll hit the same snag: pieces whose stats are rolled that I’ve not accounted for. This is skewing the numbers. In short, that list probably hides a lot more RNG noise than I’m considering.
| Item Name | Bid | Median Unit Buyout | Buyout | Quality |
|---|---|---|---|---|
| Spaulders of Egotism | - | 1.1k🟡 40⚪ | 15k🟡 30⚪ | Epic |
| Greenweave Robe | - | 949🟡 99⚪ | 10k🟡 80⚪ | Uncommon |
| Pioneer's Cloth Slippers | - | 499🟡 | 27.2k🟡 99⚪ | Rare |
| Algari Competitor's Cloth Leggings | - | 1.3k🟡 | 27.2k🟡 99⚪ | Uncommon |
| Algari Competitor's Plate Waistguard | - | 1.9k🟡 | 27.2k🟡 99⚪ | Uncommon |
| "Rhinestone" Sunglasses | - | 1.9k🟡 | 27.2k🟡 91⚪ | Rare |
| Algari Competitor's Shield | - | 1.3k🟡 80⚪ | 27.2k🟡 99⚪ | Uncommon |
| Purple Turban | - | 1.4k🟡 73⚪ | 27.2k🟡 91⚪ | Common |
| Tracker's Toughened Headgear | - | 499🟡 95⚪ | 27.2k🟡 99⚪ | Rare |
| Algari Competitor's Leather Shoulderpads | - | 1.3k🟡 | 27.2k🟡 99⚪ | Uncommon |
It turns out that the price spread might just be the game’s heavy use of random-stat gear. Items that share a name (item_id) can roll wildly different stats and item levels, so lumping them together skews the median: a bargain-bin roll drags the midpoint down, while the occasional perfect roll spikes the upper tail. Think of it like thrifting clothes: two jackets from the same label may look identical, but if one is crisp and stain-free while the other is frayed and faded, their resale prices will differ.
To see this more clearly I’ll rerun the query, but this time restrict it to the higher-quality tiers:
| Item Name | Bid | Buyout | Quality |
|---|---|---|---|
| Spaulders of Egotism | - | 15k🟡 30⚪ | Epic |
| Darkmoon Deck: Radiance | - | 27.2k🟡 91⚪ | Epic |
| Bracers of Unrelenting Excellence | - | 150k🟡 | Epic |
| Darkmoon Deck: Ascension | - | 27.2k🟡 91⚪ | Epic |
| Luminescent Bracers | - | 150k🟡 | Epic |
| Darkmoon Deck: Symbiosis | - | 27.2k🟡 91⚪ | Epic |
| Darkmoon Deck: Vivacity | - | 27.2k🟡 91⚪ | Epic |
| Bracers of Misting Ash | - | 150k🟡 | Epic |
| Chronoboost Bracers | - | 150k🟡 | Epic |
| Gigantiform Bracers | - | 150k🟡 | Epic |
I believe this confirms that my median-based calculation is misleading. Darkmoon Decks illustrate the problem perfectly: they’re trinkets that roll a single primary stat, and the card’s worth likely depends entirely on whether that stat is Agility, Strength, or Intellect. A deck with the “right” stat can be best-in-slot, whereas an off-stat version isn’t really worthwhile.
Because every variant shares the same item ID, the median is dragged down and make the good rolls look absurdly overpriced. As I continue my explorations, I believe I’ll need to address these unique item modifiers if they have this level of impact on the prices of items.
Closing Out#
I hadn’t expected the data to wander quite so far off my mental map. Skipping over item-specific stat rolls felt like a harmless simplification, yet skipping over those reshaped the whole price landscape and buried the patterns I’d hoped to spot. The role-play market blindsided me as well.
The eye-watering sums some players pay for a bit of theatrical polish caught me off guard. Clearly, any future deep-dives will need smarter tooling that handles these stat variants, and better ways of flagging outliers.